
Leading vs Lagging Metrics: Differences, Pitfalls And How To Find Early Signals
How to create a healthy mix of leading and lagging metrics to drive customer and business impact

When it comes to working with metrics, one of the most critical concepts to grasp is the distinction between leading and lagging metrics. Leading metrics are forward looking indicators that aim to predict future outcomes, while lagging metrics are retrospective and measure past performance.
One of the biggest pitfalls I’ve seen is that teams often tend to track mostly lagging metrics. Lagging metrics are useful for understanding past performance, but the problem is that by the time lagging metrics show results, it’s often too late to take meaningful action. Or in other words, you never want to get to the end of the year and realise you didn’t hit your numbers, but now it’s too late to course correct.
Especially in today’s highly competitive markets, it’s critical for product and business leaders to measure frequently, and move fast to make adjustments if something doesn’t work to drive long term customer and business results. Understanding the difference between lagging and leading metrics can make or break your ability to drive impact effectively as a product leader.
In this article, we will go through the key differences between these two types of metrics and go through examples and strategies when to use which.

Lagging Metrics: Measuring Past Performance
Lagging metrics are retrospective - they measure past events. Because they’re based on historical data, they tend to be mostly accurate and reliable in comparison to leading metrics. More on this in a second. For example:
- Revenue last month: This metric tells you exactly how much money your business brought in
- Monthly active users (MAU): This shows how many users engaged with your product in a given month
Lagging metrics are great for reporting what actually happened. They give you a clear picture of what worked and what didn’t, helping you understand outcomes and create comprehensive reporting for the business.
Leading Metrics: Early Signals Of Future Outcomes
Leading metrics, on the other hand, are forward looking. They often start as hypotheses - you believe certain actions or customer behaviours will lead to certain outcomes. Over time, you gather data to confirm or refine your assumptions. This is why they tend to be less accurate when first setting them. Examples of leading metrics include:
- Customer behaviour signals: Specific actions that your users take in your application that tend to correlate with long term engagement retention, such as frequent use of key features
- Buyer intent signals: Actions potential buyers of your solution take that indicate interest or even intent to purchase such as watching product demos or interactions with your sales and support team
Even once you gathered historical data to confirm your assumptions, you can never be entirely certain that customers showing interest in your solution will actually lead to a final purchase of course. But, leading metrics can act as powerful early indicators for future outcomes and enable us to course correct if we don't see the early signs we were expecting.
How To Combine Leading & Lagging Metrics
While many teams fall into the pitfall of focussing only on lagging metrics, I want to stress that neither leading nor lagging metrics are inherently better or worse. They simply serve different purposes. Lagging metrics are incredibly useful to reflect on performance, but to stay competitive and leave room to course correct it’s crucial to also layer in leading indicators when defining your key metrics.
Typically, I find that the best starting point for finding leading indicators is customer behaviour, especially in the early stages of engaging with your product such as pre-purchase or onboarding actions. Business results such as acquisition costs or revenue made per customer are typically the results of those early signals, and with that lagging metrics.
Example: Activation Metric As Leading Indicator
One of the most impactful leading metrics is your activation metric. Activation metrics highlight the "aha moment" when a customer first experiences the value of your product. This aha moment can happen during the first time sign up process, or also during the first few days or week of using the product.
For example, while working on a insights dashboard tool for small business owners, we once discovered that customers who added two of their existing systems within their first week of onboarding were 20% more likely to retain over three months. This made sense as our key value proposition was to show business insights in one single view, and by adding two integrations users could see the value of the product early on.
By focusing on this activation metric, we were now able to focus on:
1. Improving onboarding flows to encourage app integrations
2. Use in app messaging and email nudges to guide users toward this key behaviour
Depending on your particular product, the activation metric could take many shapes and forms. For example, a Customer Relationship Management (CRM) product may encourage you to setup your first customer entry within the first week, or an entertainment product may aim for a certain time engaging with content after sign up. If you want to read more on this, I shared further examples on my previous guest article on the Mixpanel Blog.
What If We Don’t Have Any Historical Data Yet?
This is a very common question I get, especially in the early stages of a feature or product. I always encourage product leaders to go back to the value proposition and start with an assumption, even if you don’t have historical data to identify your activation metric yet. Here are a few quick actions you can take to get started:
- Brainstorming with your team: Reflect on your key value proposition and think about behaviours that might correlate with retention
- Conducting customer interviews: Ask users about the moments they felt your product solved their problem
- Using prototypes: Observe user interactions with interactive designs to identify moments of delight - this is hard to quantify, but look for the moment your customers eyes light up when they “get the product”.
Once you define your leading metrics and start collecting data, make sure you do use historical data over time to confirm whether those assumptions were the right ones to make in the first place in order to refine your early signals.
Once You Do Have Historical Data
If you have been collecting customer data on your product for a while, you can go back through historical data to find correlations for example between your retention and early customer behaviour signals. This can be done with the help of your data team, or you can use modern analytics tools such as Mixpanel or Amplitude to visualise correlations between leading and lagging metrics.
In this case, I recommend to start by identifying your most engaged and loyal customers, for example a group of customers with high retention. As a next step, you can explore through the data which early actions those customers have in common. In a tool like Mixpanel, this may look something like this:

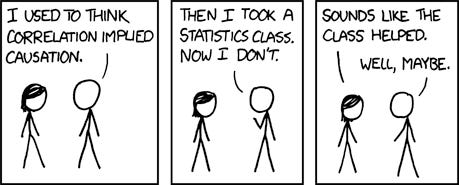
A Note on Correlation vs Causation
Just because we see that customers who do x also do y, that does not automatically mean that one action also causes the other. Make sure you consider causation vs. correlation: do the leading indicators you set genuinely lead to the desired outcomes, or are other factors influencing the results?
One of the most common examples I see is seasonality or other factors like promotions that drastically increase your sales in a given period, which could heavily skew you towards looking at a certain customer cohort. I usually recommend to analyse data of longer time periods to identify broader trends, or if this is not available be highly aware of other external factors and use your best judgement.
In Summary
When you define your key metrics, it’s essential to maintain a healthy mix of both leading and lagging indicators. Lagging metrics measure past events and are great for final reporting, while leading metrics provide early signals, helping you course correct before it’s too late.
By tracking the relationships between leading and lagging metrics, you can prioritise metrics that drive long term growth and ensure you are measuring early signals in order to course correct and stay competitive.
Customer behavior metrics, such as activation and feature usage often serve as strong leading indicators for lagging metrics like revenue or churn rates. I’m personally a huge fan especially of tracking activation metrics.
Take a moment to reflect on your product’s value proposition. Have you identified the “aha moment” that shows a user is likely to stick around? How does this relate to long-term retention? Start brainstorming or gathering data to identify early signals for your activation metric. Remember, it doesn’t need to be perfect right away - start with a hypothesis and refine it over time.
Want to get more confident with data?
Every product role requires confidence with data—I’m here to help make metrics more approachable and actionable. My book The Insights Driven Product Manager—a #1 Amazon New Release— shares real-life examples, frameworks, and templates to unlock true data insights. 📈 NEW: Check out my course, Master Product Metrics: Leveraging Data, Metrics, and AI to Drive Customer & Business Impact.
*Some links in this blog may be affiliate links, meaning I could earn a commission if you sign up or make a purchase through them. I always like to focus on teaching the principles and thinking first and foremost, but I know that having examples of recommended tools helps immensely to put things into practise. I only recommend tools and services I’ve personally used and found valuable. If you do decide to use them please use my unique referral links, as they help me keep track of demand and continue creating content for you. Thank you!